
The Stochastic indicator calculates the closing price along with the price range of a determined term under a default input of 14 periods, which means that for a daily analysis, the indicator will do the calculation over the last 14 days. What is this calculation for? Primarily to detect overbought and oversold levels.
Enhancing Stochastic Accuracy With Other Indicators
The Stochastic Oscillator, like any other indicator, has its limits. While Stochastic is a reliable indicator for detecting overbought and oversold levels, it may not be the most suitable for exploiting divergences or measuring an overall trend according to its momentums, as the RSI and MACD. In the same way, for gauging volatility, there is the Bollinger Bands indicator.
How can the Stochastic Oscillator take advantage of those indicators to enhance signals? Let’s study each case.
Check out more about Stochastic Oscillator at Altrady!
Stochastic RSI
Traders generally use the RSI along with the Stochastic to detect powerful divergences around overbought and oversold levels.
This way adds a layer of confirmation for both indicator signals since the RSI also detects overbought/oversold levels but seizes them, among other forms of signals, through divergence, while the Stochastic leverages the same levels based on crosses.
There is also a version of Stochastic RSI that integrates both tools into one single indicator. However, implementing both indicators separately can give traders a clearer reading of what’s happening in each tool.
So, how to use this combination? Let’s see the following method:
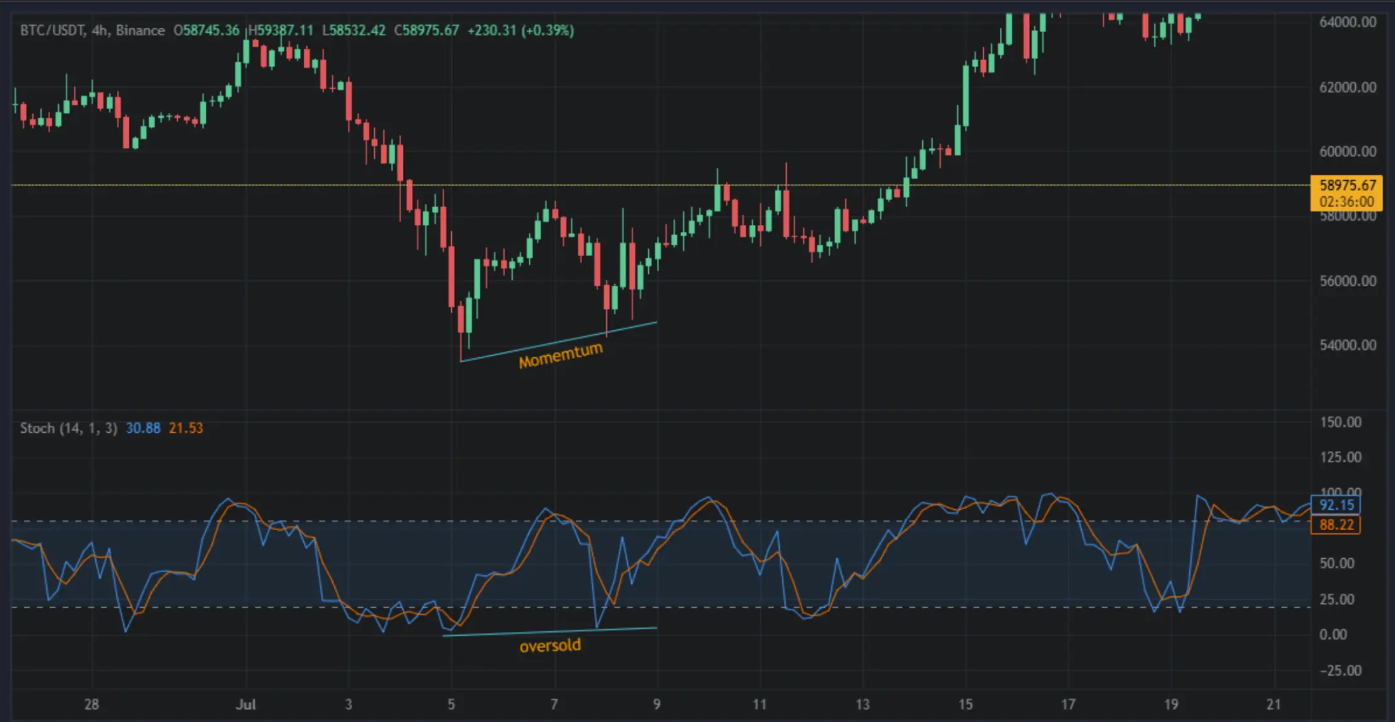
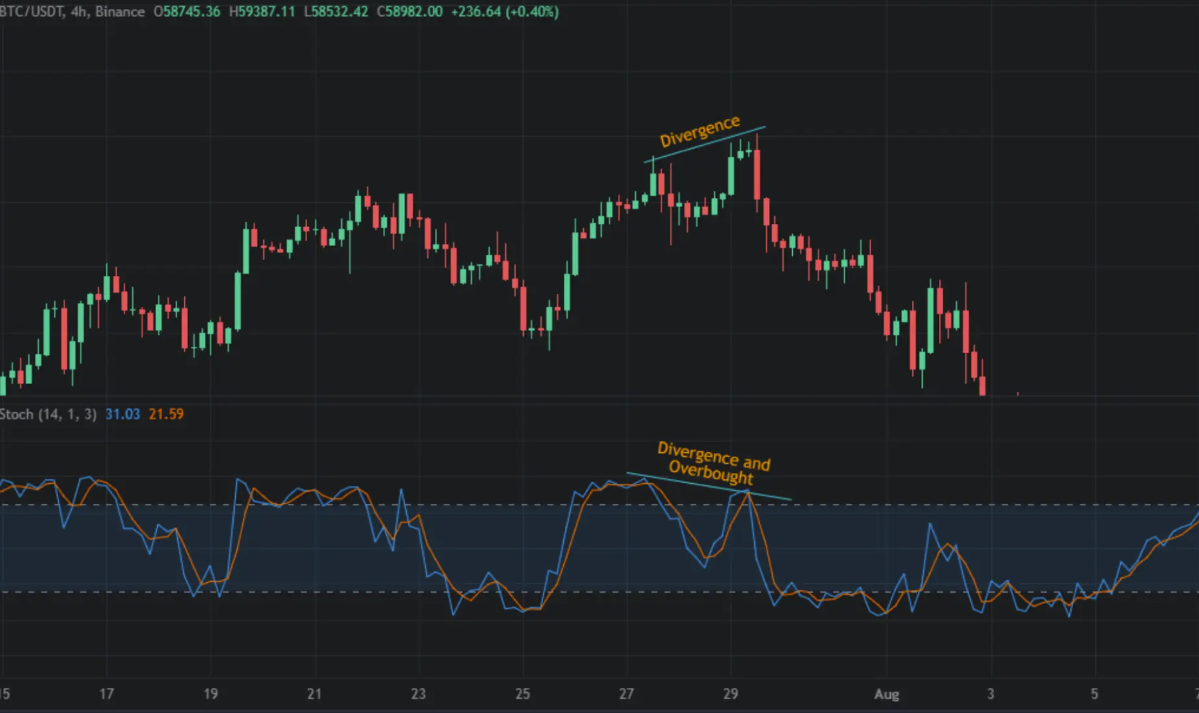
- Identifying divergence in the RSI: When the price makes a higher high but the RSI makes a lower high (bearish) or when it makes a lower low but the RSI makes a higher low.
- Detecting a cross in the Stochastic: When the price is around the overbought level (80) and the K line goes below the D Line (bearish) or when the K line goes above the D line (bullish) around an oversold level (20).
- Execute an entry after spotting both signals in confluence.
Stochastic, Trends And Volatility
Another situation where implementing Stochastic in isolation can limit its potential is during trending markets and volatile conditions. These two scenarios go hand in hand since a trend momentum can have a precedent in volatile movements.
For handling these two scenarios, traders can use:
- Bollinger Bands: An expansion through the upper or lower bands indicates increasing volatility, while a narrowing suggests a lack of volatility.
- MACD: This indicator is suitable for gauging the evolution of a trend while it features crossovers as signals for entry and exit points and a histogram to measure the trend strength.
The Stochastic with Bollinger Bands can help traders avoid moments of increasing volatility, which can lead the Stochastic to indicate false signals as it remains overbought and oversold for longer periods as a consequence.
Since a trend can last for prolonged periods, measuring its strength can help traders spot more genuine overbought and oversold zones. For this, the MACD with its histogram is the right indicator.
Check out: Stochastic Trading Strategy: Trading Signals from Stochastic!
Conclusion
Stochastic by itself works by finding overbought and oversold zones. However, the veracity of its signal can be clouded by the changing conditions in the overall market. For handling, volatility and trends, the Stochastic can work with Bollinger Bands and MACD. For accurate signals and entry points, spotting divergence with RSI is the perfect option.